While lobster red is all the hype right now through OpenClaw (fka Moltbot fka Clawdbot), I haven’t taken part. I’m curious to see how it evolves and what the scene looks like when the dust settles in a couple weeks.
Speaking of dust, I’ve been on a bit of a country music kick lately. Nothing fancy: lots of pop country, some Garth Brooke, Keith Urban, and early Taylor Swift with Florida Georgia Line, Taylor Hubbard, Nate Smith, and others. And I definitely noticed the pattern: beer, dogs, trucks, and scorned love, and small town living.
So, when guitar twang collided with AI agent, I came up with a small experiment: how prevalent is the common trope in country music?
And with the trusty help of Codex CLI and some ChatGPT, I dove in to concocting a plan and building a visualization.
As a side note, I have had a fascination with data science and data visualization. (not to brag, but I’ve had a Flowing Data membership since the beginning). Some minor experience through consulting work in PowerBI and Tableau at an enterprise level, but zero actual skill: just a not so quiet geeky admiration of the power of telling a good data backed story in the most human of senses: visualization.
Here’s how it all went down (and yes, I got AI to write the post-mortem)
Tag: Data — understand the zeitgeist from popular song lyrics
Scope narrowing: I wanted to see the mentions of trucks, dogs, beer, and girlfriends in country music over the years. So, I figured I could pull a list of top 100 country songs since 2000, their lyrics, and do a keyword frequency search.
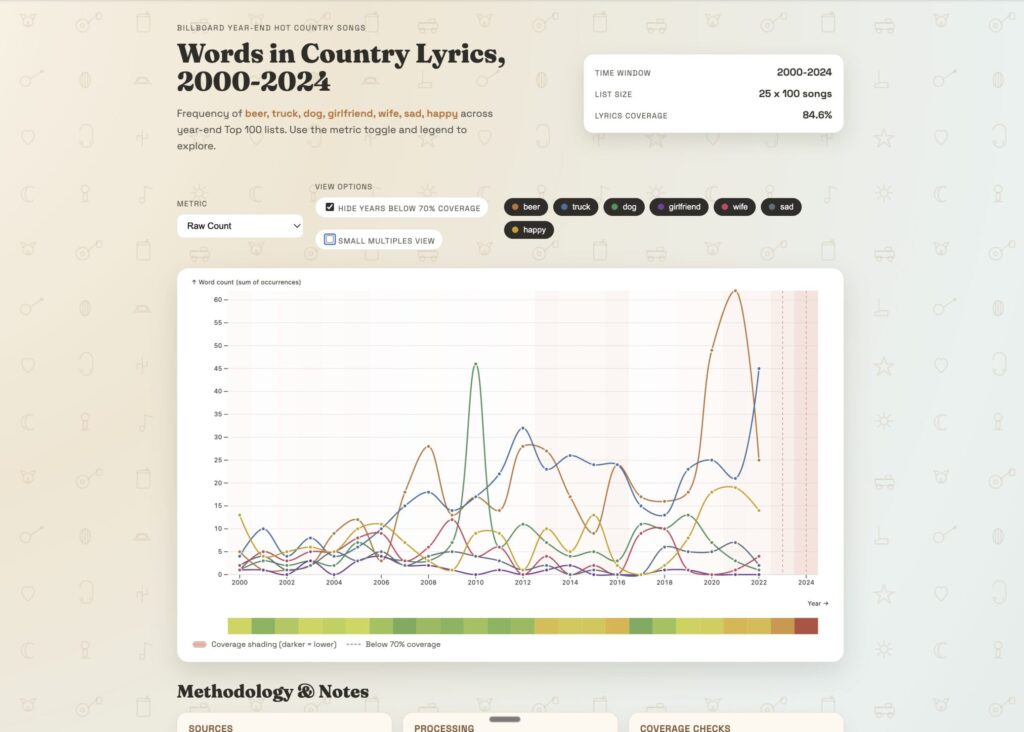
This was harder than I thought. But here’s what a few hours of Codex came up with:
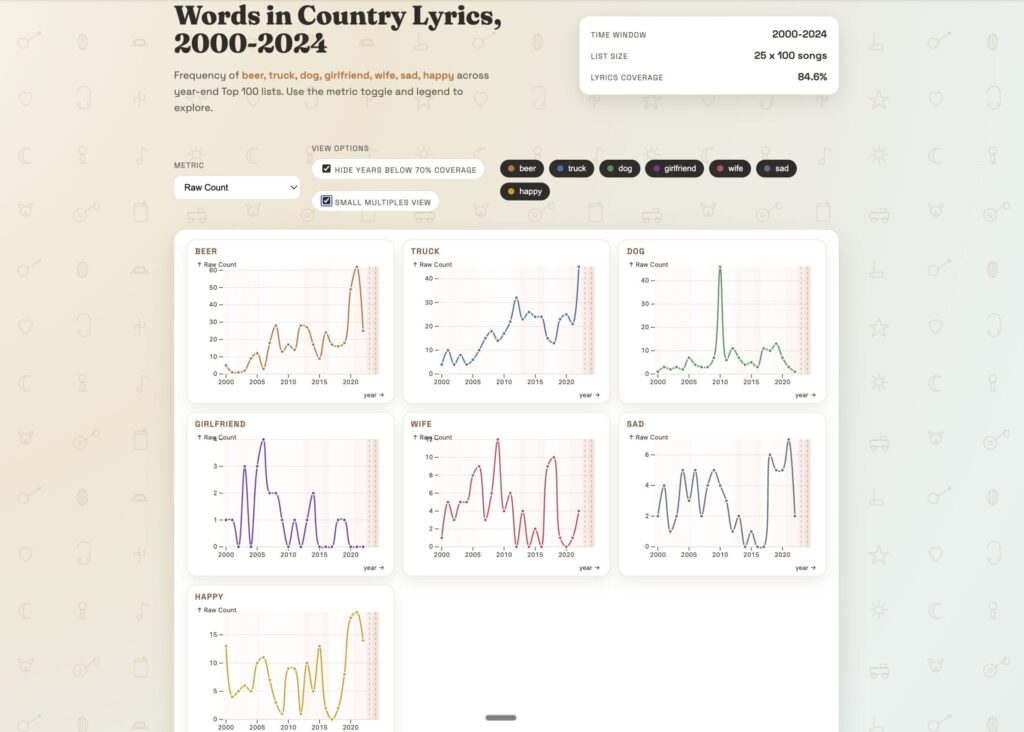
and a cool split view
I even got Codex to write a Post Mortem document in Markdown. Is the data accurate? Based on a quick assessment, I don’t think so; there appears to be some sort of bias towards the later years where words are overrepresented in the data sets. This could be because of incompleteness of lyrics, inaccurate lists, double counting, appends, etc.
Country Music Visualization Project Post Mortem
Executive Summary
This project set out to visualize how frequently a small set of words (beer, truck, dog, girlfriend, wife, sad, happy) appear in the lyrics of U.S. country songs that appear on year-end Top 100 lists from 2000 onward. The end result is an interactive, Observable Plot-based visualization with multiple frequency metrics, legend toggles, and a coverage warning overlay. We achieved the required coverage threshold (>70%) by combining a licensed bag-of-words corpus (LyricFind) with a large supplemental lyrics dataset from Kaggle. The final coverage was 84.56% overall, with some years still below threshold, and those years are explicitly highlighted in the visualization.
Concept and Goals
Primary concept: A long-run view of thematic language in country music using a stable, chart-based song universe.
Goals:
- Analyze the frequency of target words and their variants across time.
- Use year-end Top 100 lists so each year is comparable.
- Provide multiple metrics (raw count, per 10k words, % of songs with the word).
- Require a minimum lyric coverage threshold of 70% before computing results.
- Produce an interactive, lightweight HTML/JS visualization using Observable Plot.
Scope Decisions
- Years: 2000–2024 (Playback.fm has no 2025 list).
- Each appearance of a song in a given year is counted separately.
- Target words: beer, truck, dog, girlfriend, wife, sad, happy with plurals and possessives.
- Chart source: Playback.fm year-end Top 100 country lists (used as a proxy due to access constraints). This is not an official Billboard dataset.
- Lyrics source: LyricFind corpus (bag-of-words) plus a Kaggle lyrics dataset to fill coverage gaps after 2013.
Data Sources
- Playback.fm year-end country charts (2000–2024) — Used as proxy for Billboard year-end lists.
- LyricFind Corpus (bag-of-words) — Dataset includes a dictionary, lyrics as word IDs, cross-reference file, and metadata.
- Kaggle supplemental lyrics dataset — Used to improve coverage for 2014–2024.
Visualization Features
- Metric dropdown (raw count, per 10k words, % of songs with word).
- Legend toggles by word category.
- Coverage overlay: background shading by year (darker = lower coverage) plus dashed markers for years <70%.
- Inline legend for coverage overlay.
- Methodology and project notes section below the chart.
Data Accuracy Assessment
Strengths: Strong coverage for 2000–2012 and many mid-years after supplementation. A clear, repeatable matching methodology and consistent metrics.
Limitations: Playback.fm may diverge from Billboard year-end data. Kaggle lyrics dataset may include non-country songs and varying metadata quality. 2023–2024 have low coverage, and values for those years are likely undercounted.
Narratives the Visualization Supports
- Broad trend comparisons for target words over time.
- Relative prominence of certain themes (e.g., beer vs dog vs sad) in charting country songs.
- Periods of shift in language emphasis across decades.
Final Takeaway
The visualization provides a useful, transparent view of word frequency trends in country lyrics from 2000–2024. The inclusion of a coverage overlay protects against over-interpreting thin data years. The most significant limitation is chart-source accuracy (Playback.fm vs Billboard) and uneven lyric coverage in recent years. With an official chart source and a consistent, licensed lyrics dataset, this approach could be made production-grade.